
Search for reliable numbers on the voice-over job market and most of what surfaces is vendor marketing or unsourced blog claims. The U.S. Bureau of Labor Statistics, the government's own labor-market data agency, is a different kind of source: methodologically transparent, free of any commercial interest in the answer, and completely indifferent to whether the numbers flatter the industry or not. It also has a real limitation worth naming upfront: it has no occupation code for "voice actor" specifically, and never has. What it does track is a set of adjacent categories this work gets folded into, each with its own real, dated, sourced figures.
The Data Gap Itself Is the First Finding
The Bureau of Labor Statistics' Standard Occupational Classification system has no code for voice-over work as its own category. A voice actor's income and hours get scattered across whichever adjacent code most closely applies, most often "Announcers" (which itself combines broadcast announcers, non-radio disc jockeys, and public address announcers into one government profile), or occasionally "Sound Engineering Technicians" for those who also do their own audio production. Self-employed voice actors working direct-to-client, a large and growing share of the profession, are especially likely to fall outside any of these categories cleanly. That fragmentation is not a minor footnote; it means no single government number describes this profession, and any claim that cites one BLS figure as "the voice-over job market" is already oversimplifying.
An honest limitation, stated plainly
Every figure in this article describes an adjacent occupational category, not voice-over work specifically. Where BLS combines multiple job types into one reported number, that is noted directly rather than presented as a clean voice-over statistic.
"Announcers": The Closest Category, and Its Real Numbers

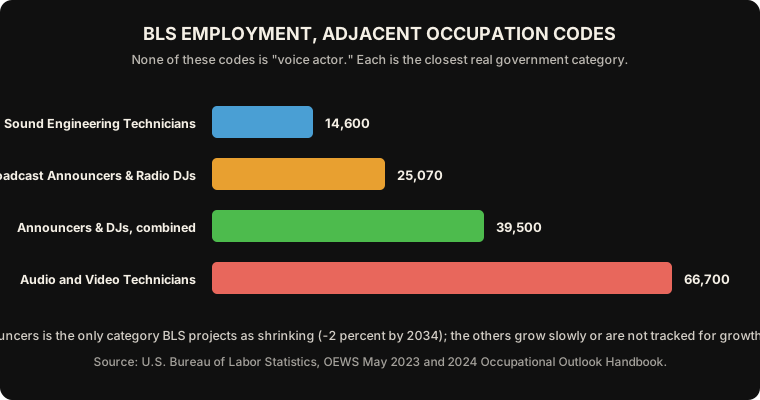
BLS's Occupational Outlook Handbook profile for "Announcers" combines broadcast announcers, disc jockeys outside radio, and public address system announcers into a single reported category: 39,500 jobs in 2024, a 2024 median pay of $21.69 an hour, and a projected employment change of negative 2 percent from 2024 to 2034, a decline rather than growth. BLS projects roughly 3,800 openings a year on average over the decade, attributed mainly to the need to replace workers who leave the occupation or exit the labor force entirely, not to growth in the number of positions. Within that combined category, BLS's separate wage survey (OEWS) reports the narrower "Broadcast Announcers and Radio Disc Jockeys" code specifically at 25,070 employed as of May 2023, with a median wage of $21.58 an hour, $44,890 a year.
Sound and Audio Technicians: A Larger, Slightly Growing Category
BLS's combined "Broadcast, Sound, and Video Technicians" profile, which includes sound engineering technicians alongside broadcast and video technicians, reports 146,100 jobs in 2024, a 2024 median pay of $56,600 a year ($27.21 an hour), and a projected employment change of positive 1 percent from 2024 to 2034, described by BLS as slower than average growth, with about 11,100 openings projected per year, again mostly from replacement rather than new positions. Narrowing to the specific "Sound Engineering Technicians" wage code, OEWS reports 14,600 employed as of May 2023 with a median annual wage of $59,430. A related, broader "Audio and Video Technicians" code reports 66,700 employed as of May 2023, a mean wage of $28.49 an hour ($59,260 a year), with the bottom 10 percent earning under $33,790 a year and the top 10 percent earning over $95,640 a year, a wide spread that reflects how differently this combined category's roles are actually compensated.
- Announcers: 39,500 jobs, $21.69/hr median, projected to shrink 2 percent by 2034. The category closest to on-air and voice-forward work, and the only one BLS projects as declining rather than growing.
- Broadcast, Sound, and Video Technicians: 146,100 jobs, $56,600/yr median, projected to grow 1 percent by 2034. A much larger category, more production and engineering focused, growing slowly rather than shrinking.
- Neither category is voice-over specifically, and BLS provides no way to isolate voice-over income or hours cleanly from either one.
What the Union Reports, and What It Does Not
SAG-AFTRA, the primary US union representing performers including voice actors, states on its own official site that it "represents approximately 160,000 actors, announcers, broadcast journalists, dancers, DJs, news writers, news editors, program hosts, puppeteers, recording artists, singers, stunt performers, voiceover artists and other entertainment and media professionals." That figure covers the entire union's membership across every represented category, not voice-over performers specifically, and SAG-AFTRA does not publish a separate voice-over-only membership count in its public materials. It is a real, sourced number about the profession's collective bargaining representation, and it is not, on its own, a voice-over employment statistic.
Union membership is not the same as market size
SAG-AFTRA membership reflects one specific form of professional organization within one country. A large and likely growing share of working voice actors, especially non-union and international performers working direct-to-client, are not captured by this number in either direction.
What This Actually Means for a Working Voice Actor
The most defensible, honest reading of the government's own data is that it does not cleanly answer "is the voice-over job market growing." The closest adjacent category, Announcers, is projected to shrink; the closest production-side category, sound and audio technicians, is projected to grow slowly; and the actual voice-over profession, increasingly freelance and direct-to-client, sits partly outside both. That is a genuinely different, more honest picture than either a doom narrative or a boom narrative built on numbers that do not actually measure this specific work. What voice-over actually pays, based on real project-level data rather than occupation codes, remains a more directly useful reference than any single BLS figure for someone pricing their own work.
↗ Try the tool
Rate Calculator
Free to try: with government job-category data this hard to map cleanly onto real voice-over work, the Rate Calculator's project-level, industry-grounded numbers are a more directly useful reference for pricing your own work than any single occupational statistic.
Open Rate Calculator →A Genuine Data Gap, Worth Naming Rather Than Papering Over
No government agency currently measures the voice-over profession as its own category, and the adjacent categories that do exist point in different directions, one shrinking, one growing slowly, neither one a clean proxy for this specific work. That gap is worth citing honestly rather than reaching for whichever adjacent number happens to support a preferred narrative, and it is worth watching whether BLS ever creates a category that actually fits a profession that has changed substantially since these classifications were built.
Sources and Further Reading
- U.S. Bureau of Labor Statistics, Occupational Outlook Handbook: Announcers: the 39,500 jobs, $21.69/hr median pay, and negative 2 percent projected growth figures.
- U.S. Bureau of Labor Statistics, Occupational Employment and Wage Statistics, May 2023: Broadcast Announcers and Radio Disc Jockeys (27-3011): the 25,070 employment and $21.58/hr, $44,890/yr median wage figures.
- U.S. Bureau of Labor Statistics, Occupational Outlook Handbook: Broadcast, Sound, and Video Technicians: the 146,100 jobs, $56,600/yr median pay, and positive 1 percent projected growth figures.
- U.S. Bureau of Labor Statistics, Occupational Employment and Wage Statistics, May 2023: Sound Engineering Technicians (27-4014): the 14,600 employment and $59,430 median annual wage figures.
- U.S. Bureau of Labor Statistics, Occupational Employment and Wage Statistics, May 2023: Audio and Video Technicians (27-4011): the 66,700 employment, wage-spread, and mean wage figures.
- SAG-AFTRA, About SAG-AFTRA: the approximately 160,000 total membership figure across all represented categories.
- VoiceEditSuite, What Voice Over Actually Pays in 2026: the companion piece on project-level pay data.
Corrections
BLS figures above reflect the most recently published data as of this article's research; BLS updates OEWS wage data annually and Occupational Outlook Handbook projections periodically, so newer figures may since have been published. No BLS or SAG-AFTRA figure specific to voice-over work alone exists, and none is claimed here beyond what each source actually states. If you spot an error or a newer published figure, tell us through the contact page and we will correct it.