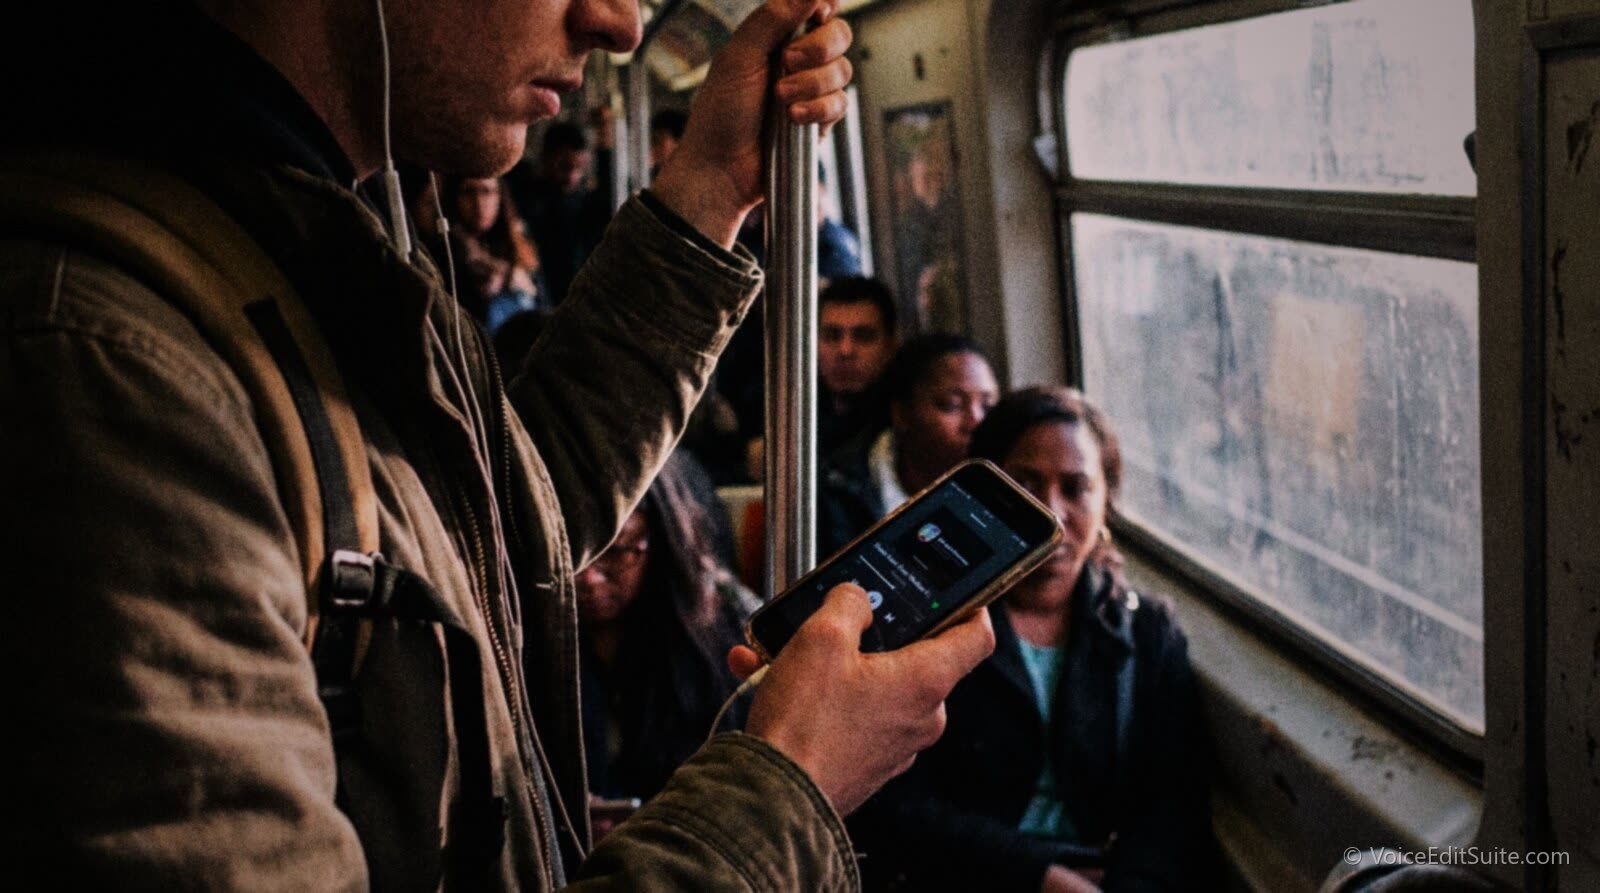
A podcast's completion rate measures how much of an episode the people who started it actually heard, and it is tracked inside Apple Podcasts Connect and Spotify for Creators as a percentage of playback time, not as a count of file requests. A download, by contrast, is recorded the moment a podcast app's server fetches an episode's audio file, whether or not a human ever presses play on it. The two numbers answer different questions, and the research on where and why listeners actually leave an episode once it starts points at a short list of specific, fixable causes rather than a vague sense that an episode was "too long" or "not good enough."
The headline finding across the sourced surveys below is reassuring: once a listener is a few minutes in, podcasts hold an audience better than almost any other medium. The hard part, and the part this Guide spends most of its time on, is the first five minutes, where published research puts the typical loss at twenty to thirty-five percent of the audience that just pressed play. Everything after that opening stretch is a smaller, gentler decline. That shape, a steep early cliff followed by a long plateau, is the single most useful fact in this article for deciding where to put your effort.

How Completion Rate Is Actually Measured
Start with the definition everyone gets wrong first. The IAB Tech Lab's Podcast Measurement Technical Guidelines, the industry standard most hosting platforms build their download counts against, define a download as a server-recorded request for an episode's media file, filtered to remove bots, malformed requests and duplicate requests from the same listener within a set window. That filtering makes the number more honest than a raw server log, but it still records file delivery, not attention. A download can be an automatic background fetch by a podcast app queuing up a new episode nobody opens for a week, or it can be someone who played ninety seconds and quit. Both count exactly the same in a download total. Podcast Industry 2026: Statistics for Independent Creators goes through what that means for the download thresholds hosting platforms publish, and why the median show's 27 first-week downloads is a weaker signal than it looks.
Completion rate is a different measurement, and the two platforms big enough to publish one define it in their own, not-quite-matching ways. Apple's own listener analytics documentation, published on Apple Podcasts for Creators, defines Average Consumption as a percentage that reflects how much of an episode listeners played per device, calculated from each listener's actual playback time against the episode's total duration, and it explicitly notes that a figure above 100 percent means some listeners played the episode more than once. Apple's companion metric, Engaged Listeners, counts anyone who reached at least 20 minutes of an episode or 40 percent of its length, whichever comes first. That "whichever comes first" clause matters more than it looks, and the chart later in this Guide works through why.
Spotify for Creators, the platform formerly called Spotify for Podcasters, measures it differently again. Its support documentation on the Audience Retention chart describes a line showing the share of listeners still tuned in at each point of an episode, with a marked median play time: the point where half of everyone who pressed play is still listening. Spotify's own analytics glossary for creators sets its completion threshold at reaching at least 95 percent of an episode's runtime, a stricter bar than Apple's, and defines retention separately again, as the share of an episode's audience who come back and play the next one. Three platforms, three different numbers, each measuring something real but not quite the same thing, which is why a completion rate quoted without saying which dashboard it came from should be read with some caution.
Three different questions, three different numbers
A download asks: did a file get requested? Average Consumption (Apple) and the Audience Retention chart (Spotify) ask: how far did the people who started actually get? Retention, in Spotify's specific sense, asks a third question entirely: did they come back for the next one? Treat the three as a funnel, not as interchangeable synonyms for "how well is my show doing."
Where Listeners Actually Drop Off
Edison Research has asked US monthly podcast listeners how much of a typical episode they get through since at least 2019, and the shape of the answer has stayed remarkably stable. In its 2019 Podcast Consumer study, 52 percent of monthly listeners said they typically listen to the entire episode, 41 percent said most of it, 5 percent said less than half, and just 2 percent said only the beginning. By its 2026 edition, reported in June by Inside Audio Marketing, Edison was putting the same behaviour more simply: seventy percent of weekly podcast consumers finish all or most of every episode they start, which Edison describes as the highest completion rate it measures across any digital medium. Both figures say the same thing from different angles. Once someone is genuinely into an episode, they tend to stay.
The research that explains where the other listeners go comes from inside a podcast platform's own data rather than a survey. NPR's training site published an article in 2025 by Tamar Charney, the network's longtime editorial lead on NPR One, citing an internal analysis by NPR One's data team that found a typical episode loses twenty to thirty-five percent of its listening audience in the first five minutes, a steeper drop than at any other point in the episode right up to the closing credits. The same piece notes that episodes in roughly the eighteen-to-thirty-minute range tended to hold NPR One's audience best, though NPR frames that as an internal observation from its own catalogue rather than a universal rule, and this Guide treats it the same way: real, sourced, and specific to one large public-radio podcast platform's listenership, not a law of podcasting.
Why People Say They Quit, in Their Own Words
A September 2025 survey of 1,200 US podcast listeners, run by Point-To-Point Marketing with Strategic Solutions Research and reported by Inside Radio, asked people directly rather than inferring it from playback logs, and the answers line up neatly with the NPR data. One in three listeners said they stop an episode early at least half the time. Three in four said they want hosts to either get straight into the topic or keep any opening chatter short. Asked why they quit episodes, the reasons they gave were repetition, a lack of structure, and episodes simply running too long. None of those four reasons is a complaint about subject matter. All four are complaints about pacing, which is the part of a podcast an editor controls directly and a microphone cannot fix.
Put the quantitative and the self-reported evidence side by side and a single, coherent argument appears: the medium does not have a loyalty problem, it has an entrance problem. A listener who makes it past the opening few minutes will, on the evidence above, give a show almost everything it has. The fight for an episode's completion rate is overwhelmingly a fight for its first five minutes, not a fight for its thirty-fifth.
Episode Length, Intro Length, and the Engaged Listener Math
Episode length itself turns out to be harder to pin a single retention number to than most podcasting advice suggests, and it is worth being honest about that rather than inventing a benchmark where the evidence does not support one. One analysis of more than ten thousand active podcasts found a median episode length of 31 minutes and an average of 38 minutes, with no single length performing best across the whole sample, and it found the ideal varying a great deal by genre. Buzzsprout's own July 2026 platform statistics page, covering the shows it hosts, puts the 20-to-40-minute band as the most common single length, at roughly 30 percent of shows. Neither of those is a completion-rate figure. They describe what podcasters are choosing to make, not what proportion of listeners actually finished each length, and no major platform or research firm has published a reliable completion-rate-by-length table that would let you compare, say, a 20-minute show against a 90-minute one on equal footing. Treat any very precise claim to the contrary as unverified.
What is verifiable, and genuinely useful, is a quirk in how Apple's own Engaged Listeners metric is defined. Remember the rule: at least 20 minutes of an episode, or 40 percent of its length, whichever comes first. Work through what that means at different episode lengths and the bar quietly gets proportionally easier to clear as a show gets longer, which is worth understanding before you compare your own Engaged Listener percentage across episodes of different lengths.
Below roughly fifty minutes, the 40 percent proportional rule reaches a listener first, so a 10-minute episode needs a genuinely engaged 4 minutes, and a 30-minute episode needs 12. Past fifty minutes, the fixed 20-minute floor takes over, so a 60-minute episode only needs 20 minutes, a third of it, and a 120-minute episode needs the same 20 minutes, under a sixth of its length. None of that means long episodes are secretly more engaging. It means the specific published metric called Engaged Listeners is not a fair like-for-like comparison across different episode lengths, and a podcaster reading two episodes' Apple dashboards side by side should know that before drawing a conclusion from the gap.
Where length does have a documented effect is on ad load, which is a pacing issue by another name. Magellan AI's Q2 2025 Podcast Advertising Benchmark Report, an analysis of nearly 95,000 US episodes run between April and June of 2025, found that episodes under 15 minutes carried an average ad load of 21.8 percent of their total play time, the heaviest proportional load of any length band in the report. A short, ad-heavy episode is asking a listener to sit through more interruption per minute of actual content than a longer show does, right at the point in an episode, per the NPR and Point-To-Point Marketing findings above, where patience is already thinnest. If your show runs short and carries two or three spots, where you place them and how tightly the surrounding content is edited matters more than it would in an hour-long episode with the same ad count spread over far more runtime. Host-Read Podcast Ads: 2026 Rates, Pricing and Delivery covers placement and pacing for exactly that situation.
Audio Quality Is a Retention Variable, Not Just a Polish Issue
Completion data and audio-quality research turn out to be measuring the same underlying mechanism from two different directions. In 2018, Eryn Newman of the Australian National University and Norbert Schwarz of the University of Southern California ran a pair of experiments, described fully in Does Bad Audio Make People Stop Listening?, in which the same recorded talks were played to different listeners with the sound quality degraded on one copy and left clean on the other. The words, speaker and content were identical in both versions. Listeners who heard the degraded copy rated the speaker as less intelligent and less likeable, and rated the research itself as less important, purely because the audio was harder to process.
"When you make it difficult for people to process information, it becomes less credible."
That mechanism, psychologists call it processing fluency, explains why hiss, hum, uneven levels and a ringing room cost you listeners in exactly the window the completion data says is most dangerous: the first few minutes, before a listener has decided you are worth the extra effort of concentrating through bad sound. A noisy opening does not just sound unpolished. It raises the cognitive price of the first impression at the precise moment the Point-To-Point Marketing survey found listeners are already deciding whether to stay, which means a clean, evenly levelled cold open is not cosmetic. It is a direct lever on the completion number sitting in your analytics dashboard.
↗ Try the tool
Auto Clean Up
Dead air, a slow start to a sentence, a retake left in by accident: every second of unedited drag gives a listener another reason to tap away during the exact window the research says is most dangerous. Auto Clean Up transcribes an episode, quietens breaths in place without flattening the pause, drops false starts and off-mic chatter, and tightens dead air automatically, so the opening minutes move at the pace that keeps a first-time listener past the point where the data says most people leave.
Open Auto Clean Up →Does Watching on Video Change Completion?
Edison Research's Infinite Dial 2026 reports that 57 percent of Americans who have ever consumed a podcast now both listen and watch, and video has become a large enough share of the medium that it is a fair question whether sitting in front of a screen makes people more or less likely to finish. The Podcast Atlas, a 2026 study from Sounds Profitable and Signal Hill Insights surveying more than 5,000 US consumers, addressed that question directly and found that audio-only and video listeners showed nearly identical episode completion behaviour, which the study's authors presented as evidence against the assumption that watching on video is inherently a lower-attention, more distractible way of consuming a show.
"Video isn't replacing podcast audio. It's expanding the tent. Whatever your feelings on video podcasts, the data is clear: this is a dual-format medium now."
For a podcaster deciding whether video is worth the extra production load, that finding reframes the question usefully. The evidence does not support worrying that video viewers quit faster than audio listeners. It does support the separate point made earlier in this Guide: whichever format someone is in, the thing that keeps them there is the same, a tight opening, clean sound and a structure that does not waste the audience's patience. Podcast Audio Standards 2026: Apple, Spotify, YouTube has the loudness and technical specs each platform expects from the file itself, audio or video.
What Actually Helps, According to the Evidence Above
Pull every sourced finding in this Guide into one list and a short, specific set of levers emerges, each one tied back to a cause rather than offered as received wisdom. None of them requires new equipment.
- Make the first five minutes earn their place. The steepest drop in every source above happens there. Get to the actual subject quickly rather than opening with several minutes of logistics, callbacks to last week, or unstructured catching-up between hosts.
- Keep opening chatter short on purpose, not by accident. Three in four listeners in the Point-To-Point Marketing survey said they want a show to either dive straight in or keep the small talk brief. That is a direct, stated preference, not a guess about attention spans.
- Treat audio quality in the opening minutes as a retention metric, not a nice-to-have. The Newman and Schwarz research shows the same words judged differently purely because of sound quality, and that judgement happens before a listener has consciously decided anything.
- Cut dead air and false starts rather than leaving them for "authenticity." Every second a sentence takes to actually start is a second a first-time listener spends deciding whether to stay, during the window the data says is riskiest.
- Pick a length that fits the content, and say so in the title or description. No sourced benchmark says a specific runtime wins across the board, but a listener who knows what they are committing to upfront is less likely to bail out of surprise.
- Measure your own numbers on the platform that reports them, and know which definition you're reading. Apple's Average Consumption, Apple's Engaged Listeners and Spotify's 95 percent completion threshold are three different calculations. Compare an episode against its own past performance on the same metric, not against a number from a different platform.
Structuring an Episode Around the Drop-Off Curve
Put the sourced data points from earlier in this Guide on one timeline and the practical implication for structure becomes visible rather than theoretical. The steepest loss, twenty to thirty-five percent by NPR One's internal measurement, happens in the first five minutes. After that, Edison's figures say the curve flattens out hard: the seventy percent of weekly consumers who finish all or most of an episode are, overwhelmingly, people who survived that opening stretch. The shape is a cliff followed by a long, gentle slope, not a steady, even bleed from start to finish.
That shape argues for a specific allocation of editing effort. Spend the most time, and the tightest cut, on the first five minutes: the cold open, the setup of what the episode is actually about, and the first guest answer or story beat. A noise removal pass, a breath-and-pause tighten, and a level check matter everywhere in an episode, but they matter most in the stretch the data says is costing you the most listeners, because that is also the stretch where a listener has the least patience for anything that makes the content harder to follow. The back half of a long episode can tolerate a slightly looser pace precisely because the audience still there has already decided to stay.
This is also where ad placement interacts with retention rather than sitting apart from it. A pre-roll ad lengthens the time before the actual hook arrives, right inside the window the data says is most dangerous; a mid-roll placed a few minutes after a strong cold open, once a listener has already decided to stay, interrupts far less damagingly. The worked rate examples and placement guidance in Host-Read Podcast Ads: 2026 Rates, Pricing and Delivery are written with exactly that trade-off in mind.
It is also worth noting that this entire completion-rate conversation is specific to podcasts, and does not transfer cleanly to every long-form audio format. Audiobook listeners commit to a format built around finishing a whole book over many sittings, often over weeks, and the growth and lending data covered in Library Lending Data: The Audiobook Boom describes a very different consumption pattern, one with far less of the cold-open urgency this Guide has been about. If you make both a podcast and an audiobook-style narration, do not apply a podcast retention lesson to the audiobook, or vice versa, without checking whether the underlying listening behaviour actually matches.
Frequently Asked Questions
What is a good podcast completion rate?
There is no single published cross-industry benchmark, because Apple, Spotify and the research firms all measure it differently and none has released a reliable percentile table. What is well sourced is the overall shape: Edison Research's 2026 Podcast Consumer study found seventy percent of weekly listeners finish all or most of an episode they start, so once you are past the opening few minutes, strong completion is the norm, not the exception. Compare your own episodes against your own past episodes on the same platform's metric rather than chasing an outside number.
Why does my download count not match how engaged my audience seems?
Because a download and a completed listen are recorded by different mechanisms entirely. The IAB's measurement standard counts a download the moment a podcast app's server requests the file, whether a human plays any of it or not. Completion rate, as Apple and Spotify define it, is calculated from actual playback time. A show can have a healthy download count and a mediocre completion rate, or the reverse, and both numbers are telling you something true, just not the same thing.
Why does so much drop-off happen in the first five minutes specifically?
NPR Training's 2025 article, citing NPR One's internal data, found a typical episode loses 20 to 35 percent of its audience in that window, more than at any later point. The self-reported reasons line up with that: a September 2025 survey by Point-To-Point Marketing and Strategic Solutions Research found listeners quit early over repetition, a lack of structure, and length, and three in four said they want hosts to get to the point quickly. The first five minutes are where a new listener is actively deciding whether the show is worth the time, and every source cited in this Guide points at that window as the one that matters most.
What is the ideal podcast episode length for retention?
No reliable, published completion-rate-by-length benchmark exists, and claims that give a precise percentage for different length bands should be treated with caution. An analysis of more than ten thousand active shows found a median length of 31 minutes with no single ideal across genres, and NPR's internal data pointed to roughly 18 to 30 minutes performing well on its own platform specifically. The honest answer is to match length to how much content you actually have, and to be aware that Apple's Engaged Listeners metric gets proportionally easier to hit as episodes get longer, which can make a longer show's dashboard look stronger without it actually holding attention any better.
Do video podcasts have worse completion rates than audio?
The sourced evidence says no. The Podcast Atlas, a 2026 study from Sounds Profitable and Signal Hill Insights, found audio-only and video listeners showed nearly identical completion behaviour. The same factors that hold an audio audience, a tight opening and clean, well-paced sound, appear to hold a video audience just as well.
Sources and Further Reading
- IAB Tech Lab, Podcast Measurement Technical Guidelines: the standard definition of a download as a filtered server-side file request, not a play.
- Apple, Listener Analytics on Apple Podcasts for Creators: the official definitions of Average Consumption and Engaged Listeners used throughout this Guide.
- Spotify for Creators, Audience Retention help article: the Episode Performance chart and median play time definition, and Spotify's Analytics glossary for its completion and retention definitions.
- Edison Research at SSRS, The Podcast Consumer 2019: the entire-episode, most-of-it, less-than-half and just-the-beginning figures.
- Edison Research at SSRS, The Podcast Consumer 2026, as reported by Inside Audio Marketing, June 2026: the seventy percent completion figure among weekly consumers.
- Edison Research at SSRS, The Infinite Dial 2026, March 2026, and the release as carried by Podnews: video-and-audio consumption share and the Megan Lazovick quotation.
- Tamar Charney, How to hook your podcast audience, NPR Training, 2025: NPR One's internal first-five-minutes drop-off figure and length observation.
- Point-To-Point Marketing and Strategic Solutions Research, The Podcast Study, September 2025, 1,200 US podcast listeners, as reported by Inside Radio: the one-in-three and three-in-four findings and the stated reasons for quitting early.
- Magellan AI, Q2 2025 Podcast Advertising Benchmark Report, as reported by eMarketer: the 21.8 percent ad-load figure for episodes under 15 minutes, from a sample of 94,938 episodes.
- Sounds Profitable and Signal Hill Insights, The Podcast Atlas: the finding that audio and video listeners show nearly identical episode completion behaviour.
- Newman, E. J., and Schwarz, N. (2018). Good Sound, Good Research: How Audio Quality Influences Perceptions of the Research and Researcher. Science Communication, 40(2), 246 to 257.
- University of Southern California, Dornsife College, The quality of audio influences whether you believe what you hear, April 2018: the Norbert Schwarz quotation.
- VoiceEditSuite Guides: Does Bad Audio Make People Stop Listening?, Podcast Industry 2026: Statistics for Independent Creators, Host-Read Podcast Ads: 2026 Rates, Pricing and Delivery, Podcast Audio Standards 2026 and Library Lending Data: The Audiobook Boom.
Corrections
Figures above are drawn from the named platform documentation, research reports and news coverage linked in the Sources list, each current as of publication in October 2026, and are revised by their publishers over time; Apple's and Spotify's analytics definitions are quoted and described from their own current support documentation and may change as those products change. Where a widely repeated completion-by-length statistic could not be verified against a primary source, this Guide says so explicitly rather than presenting it as data; those sections are marked illustrative. The Edison Research 2019 and 2026 completion figures come from two different survey waves and are not directly comparable question-for-question. Spot an error? Tell us through the contact page and we will correct it with a note.